A GUI to clean data with PySide
I work a lot with time series data from an instrument that measures trace gases in the atmosphere. This instrument (a time of flight chemical ionisation mass spectrometer) outputs data for a range of chemical species (some well understood and others not so much).
The instrument response is different for each species and can vary as a results of a number of different factors e.g. the presence of water vapour or changes in the reagent ion count. The response requires calibrating and the instrument background needs accounting for. These can drift and so are performed regularly and vary throughout the time series.
Often the data requires cleaning where, for instance, instrument electronics or pressure changes within the instrument causes spikes in the time series that need to be removed.
I like to export the instrument time series from the native data processing programme and work with the data in pandas. Typically I work with the data in a notebook where I can quickly draft plots and play with data, using code snippets and functions I’ve written. More often than not it’s also where I process the data.
Doing this once or twice is fine, but it isn’t the most efficient way of usiung the functionality I’ve written to work on these datasets. If I had a standardised programme, rather than importing or copying a function and adapting it for the specific data set, I could trust the repoducibility of the processed data, and could pass the programme on to others.
This presents a good opportunity to do some GUI and object oriented programming that wraps pandas functionality and functions I’ve already written. The GUI library I used is PySide, a python binding of the cross-platform GUI toolkit Qt. The documentation is extensive and the paradigm of programming seems fairly simple. As an example, here is how the toggle legend button of my GUI programme works:
from PySide import QtGui
# Initialise widget and set some attributes
self.legend_button = QtGui.QPushButton("Legend", self)
self.legend_button.setCheckable(True)
# Bind the method (self.ToggleLegend) to the widget
# (self.legend_button). The method is called when the
# signal (pressed) is emited
self.legend_button.pressed.connect(self.ToggleLegend)
# Define the ToggleLegend method. This sets a flag and
# changes some styling of the button. The plot method
# (DisplayData()) is then called.
def ToggleLegend(self):
if not self.legend_button.isChecked():
self.legend=True
self.legend_button.setStyleSheet("background-color: Blue")
else:
self.legend=False
self.legend_button.setStyleSheet("background-color: None")
self.legend_button.setEnabled(True)
self.DisplayData()
# The snippet from self.DisplayData() that toggles
# the legend of a matplotlib plot
if self.legend:
self.ax.legend().set_visible(True)
else:
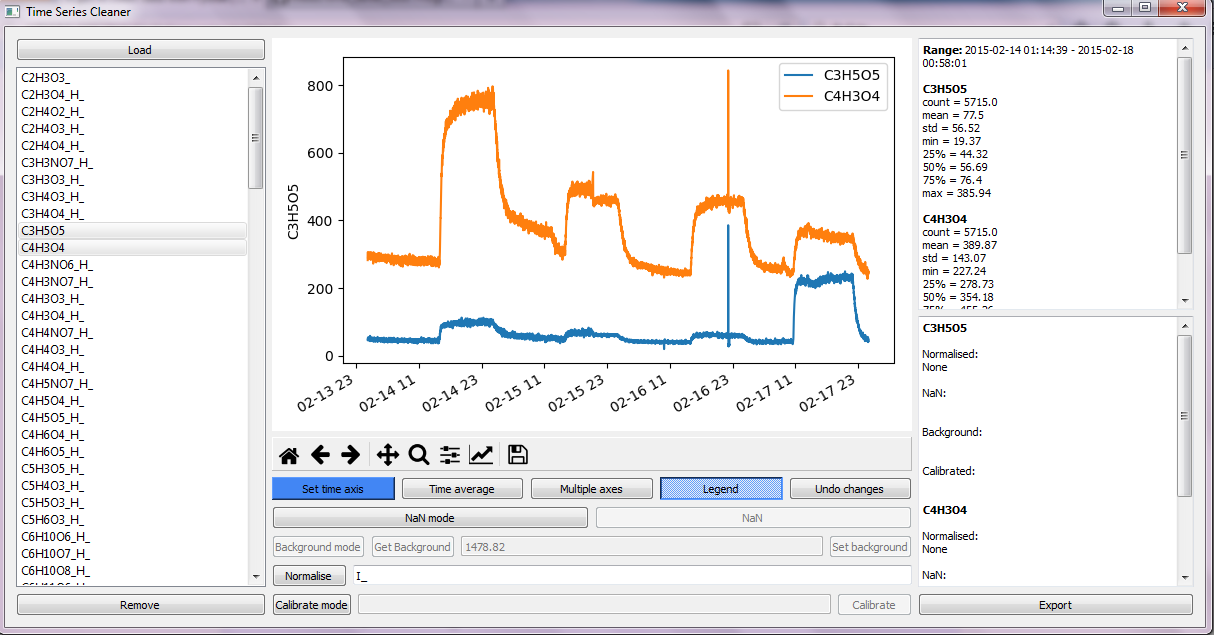
self.ax.legend().set_visible(False)The GUI displays statistical information of the selected time series that updates depending on how the data is manipulated. By exporting the data from the programme as a csv file, a second file detailing the manipulations performed on the loaded data is also generated, which makes re-tracing the steps to the finished data product easy.
I’ve used this programme to clean and prepare data from different experiments and it has no doubt sped up the processes. The programme is by no means complete. As ever, this is a work in progress. There’s an absolute tonne more of functionality to add and de-bugging to be done. The code is available here.