Predicting peaks in mass spectra using mass defect
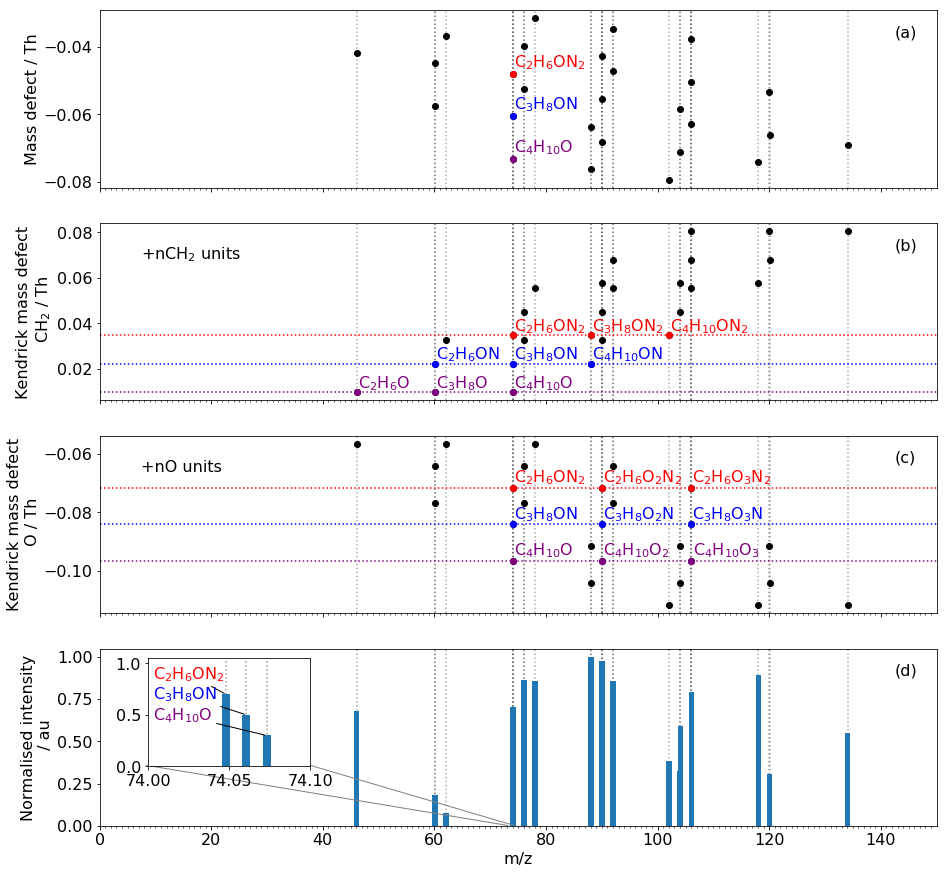
Fig 1. Demonstration of the KMD matching programme on a subset of chamber data with the reagent ion removed. A. mass defect. B. Kendrick mass defect (CH2). C. Kendrick mass defect (O). D. mass spectrum, inset is a portion of the mass spectrum. 27 signals are present in the spectrum but isobars reduce the number of observed peaks to 15. The clusters of signal in the mass spectrum appear regular with a +n14 repeating unit but does not provide information on what moiety is contributing to the increase. The three identified species C2H6ON2, C3H8ON and C4H10O inset are an example of isobars. In the series, CH2 units increase as N units decrease but both have an integer mass of 14 Da making the identification of the + n14 peaks in the spectrum ambiguous. Plotting the Kendrick mass defects of the identified species exhibits the relationship between their exact peaks at any one given unit mass and their unidentified counterparts +n14 m/z.
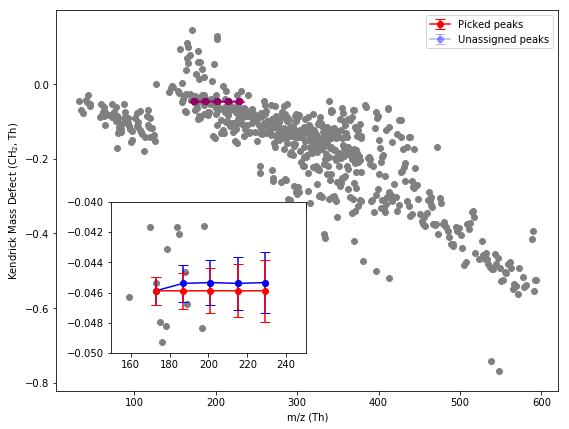
Fig 2. Kendrick Mass defect plot of the identified peaks in this dataset (grey). Plot inset shows exact masses (red) and measured masses (blue) of the C2-C2 organic acids in CH2 Kendrick mass defect space. Error bars show propagated 20 ppm error. All measured peaks are well within error. The exact masses (red) show where the measured masses should be found on this plot, connected by a straight line. Where the assignment is measured (picked, blue) the error in the exact mass is visible as a deviation from the straight line. The transition from formic to acetic acid shows a deviation in the straight line which is a manifestation of the systematic error in the mass axis. All subsequent measured peaks sit on a straight line, indicating that there is no more deviation and so the error in the mass axis is propagated but not compounded.